A work-and-rest plan for the next shift in extreme heat, grounded in 90+ official standards.
Enter the heat conditions on the ground. The calculator returns how many minutes per hour it is safe to work, how long to rest, how much water to drink, which controls are required, and a clear stop-work alert the moment any applicable rule is breached.
It is a planning instrument, not a risk dial. Every other heat tool answers “what is the risk level right now?” This one answers “how do I schedule the next 4 to 8 hours of work safely?” It never averages conflicting standards into a false middle. When two rules disagree, it keeps the more protective one.
How to read a result
The flow is one screen: enter the conditions, read the plan. You give it the heat, the type of work, and how long the crew has been in the heat. It gives you a schedule you can act on.
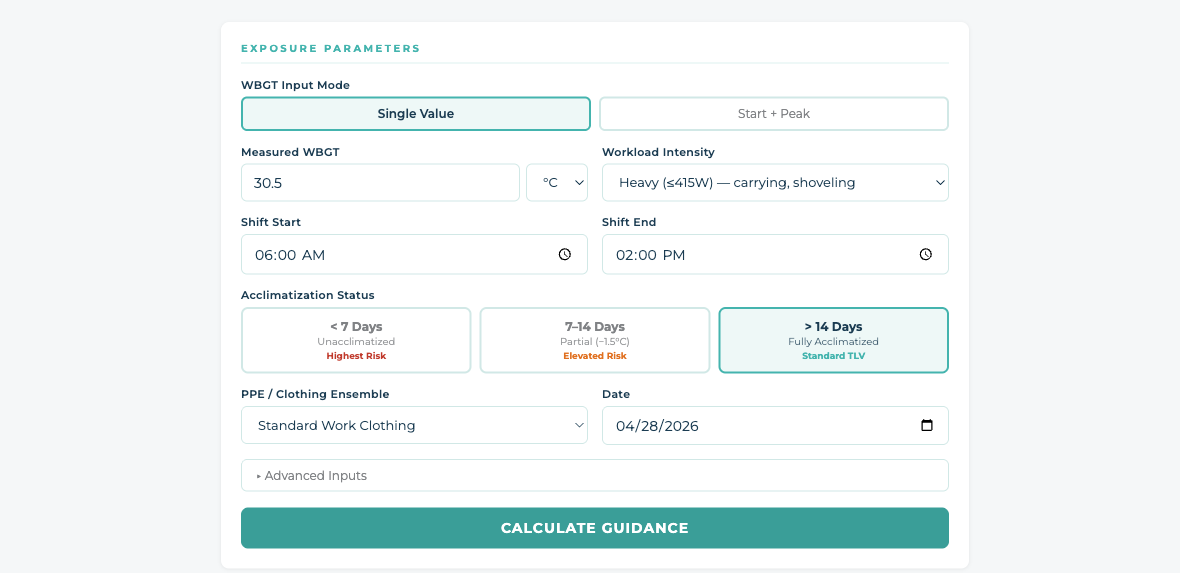
WBGT (Wet Bulb Globe Temperature) is the single number the whole tool runs on. In plain terms it rolls heat, humidity, sun, and wind into one figure that reflects how hard the body has to work to stay cool. A dry 35°C in shade and a humid 35°C in full sun are very different jobs, and WBGT tells them apart.
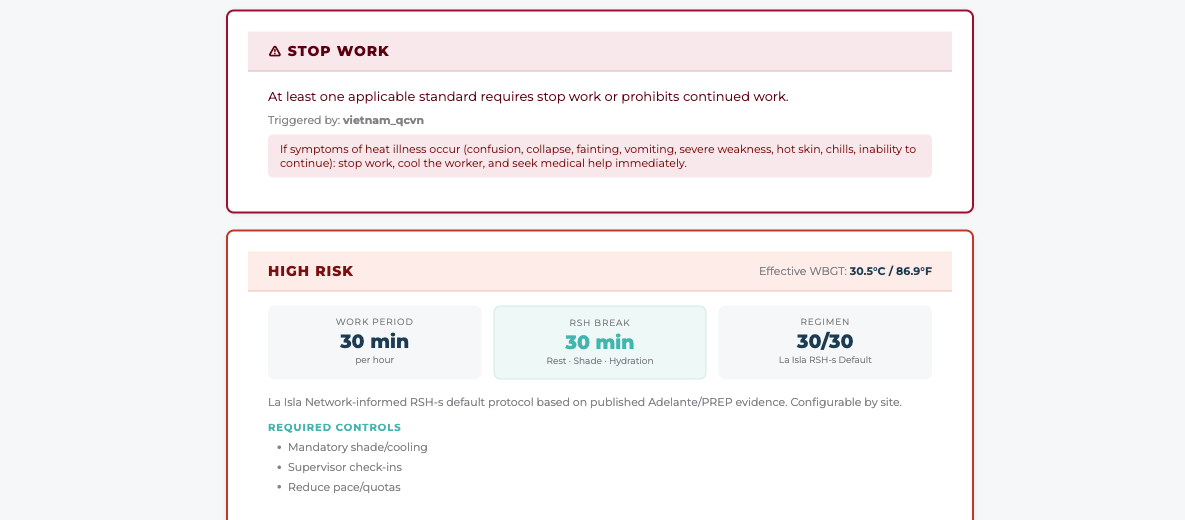
Two ideas make the number trustworthy. Read these once and the rest of the tool makes sense:
Dozens of standards may apply at once. The tool doesn’t split the difference. It takes the strictest work limit and the longest required rest across all of them. A compromise between a safe rule and an unsafe one is still unsafe.
If any applicable standard says conditions require ceasing work, that wins outright. The schedule is replaced by a stop-work banner naming the standard that triggered it.
Why La Isla RSH-s is the primary guidance
The calculator shows dozens of standards, but one is pinned first and drives the default plan: the La Isla Network RSH-s protocol (Rest, Shade, Hydration, Sanitation). It is the default because it is the rare heat protocol built for outdoor manual laborers and then measured on them, rather than derived from lab studies of resting subjects.
Most WBGT tables trace back to controlled experiments on young, fit, acclimatized men. La Isla built RSH-s through its Adelante Initiative and tested it on sugarcane crews in Nicaragua across consecutive harvests, tracking the outcome that actually matters for this workforce: acute kidney injury, the early damage behind the chronic kidney disease (CKDnt, also called Mesoamerican nephropathy) that has become an epidemic among Central American agricultural workers.
“The learning curve for the various stakeholders as well as the barriers to success demonstrate that effectiveness of an intervention cannot be adequately assessed without considerations of implementation.”
Glaser, Wegman, Arias-Monge, et al. “Workplace Intervention for Heat Stress: Essential Elements of Design, Implementation, and Assessment.” Int. J. Environ. Res. Public Health, 2022. PMC8998134That quote is the reason RSH-s sits at the center of this tool. A threshold on a chart tells a supervisor when to worry; RSH-s pairs the schedule with the controls that produced those field results: mandatory shade, a real hydration plan, sanitation, and rest that carries no penalty. The calculator’s kidney-risk and productivity panels draw on the same body of work (Chapman et al., 2020 on kidney biomarkers, and Hansson et al., 2024 on the productivity cost of heat above 28°C WBGT).
Choosing RSH-s as the default locks nothing in. Every other national and technical standard is evaluated next to it, and the composite always keeps the most protective applicable result. When a legal stop-work rule is stricter than RSH-s, that rule wins. La Isla sets the floor, and the law can raise it.
Try the real engine
The widget below runs the identical calculation engine that powers the app and the REST API. It calls FORMULAS.compareStandards() then FORMULAS.getMostProtective(), evaluated in your browser against every registered standard. Nothing here is a mockup or a canned response. Drag the slider and change the selects; everything recomputes instantly.
The composite verdict can be stricter than the La Isla card below it. That is the stop-work override in action: one standard’s hard cease-work call overrides every schedule.
The guidance it pulls from
The registry holds 90+ standards from governments, armies, sports bodies, and industry groups. They don’t all work the same way, so the tool sorts them into a small taxonomy and treats each type appropriately.
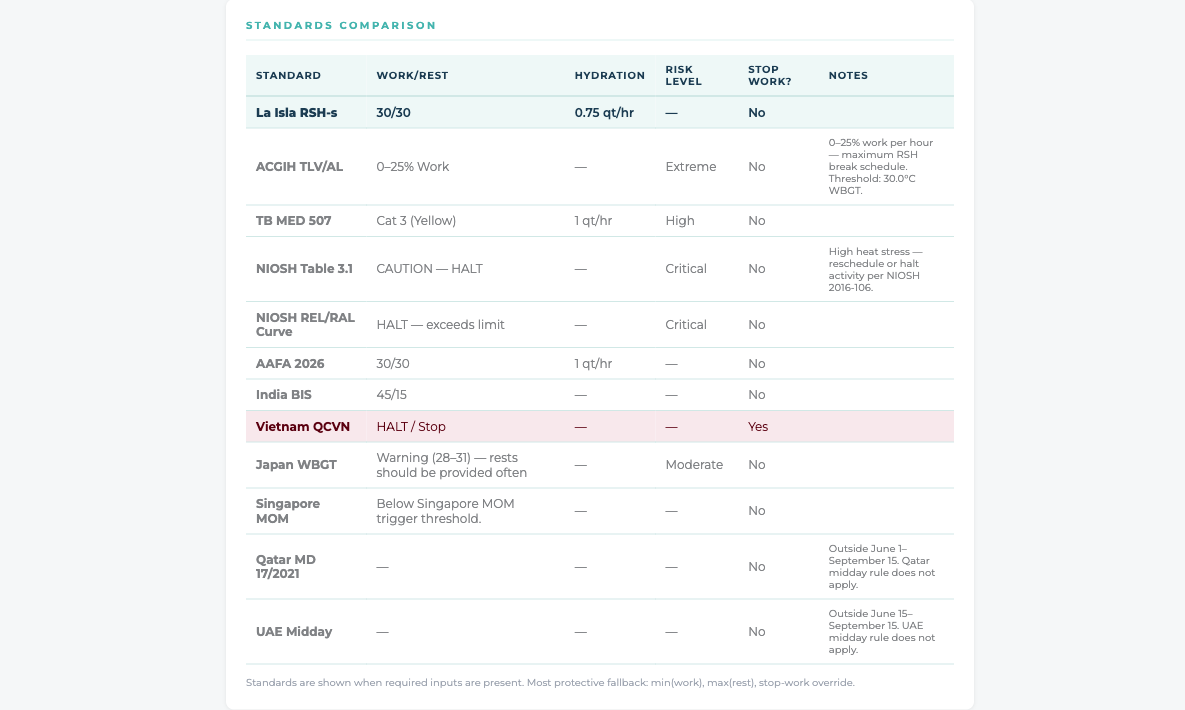
The standard families, in plain terms:
- Full work/rest schedules. A WBGT-banded table of work and rest minutes (La Isla RSH-s, ACGIH TLV, TB MED 507, NIOSH, India BIS, Vietnam QCVN, China GBZ, and many national rules). These are the engines that produce the minutes-per-hour numbers.
- Stop-work and midday-ban triggers. A threshold that prohibits work outright, such as the Gulf-state midday bans (Qatar, UAE, Oman, Bahrain, Kuwait).
- Screening limits. A single reference ceiling that says “past this line, act” rather than a full schedule (NIOSH curve, ISO 7243, Japan WBGT).
- General-duty and governance overlays. Employer-obligation frameworks that require controls without prescribing minutes (Germany ASR A3.5, UK HSE, the EU framework directive, and similar).
- Advanced physiological models. ISO 7933 Predicted Heat Strain and Australia’s Thermal Work Limit run their own biophysical model rather than a lookup table.
Internally these map onto seven rule types (schedule_engine, mixed_trigger_schedule, stop_work_rule, screening_limit, control_overlay, alert_overlay, smoke_overlay). Only the first three ever feed the composite schedule and stop-work verdict; screening, overlay, and wildfire-smoke rules are always shown but never folded into the work/rest math.
The operational outputs
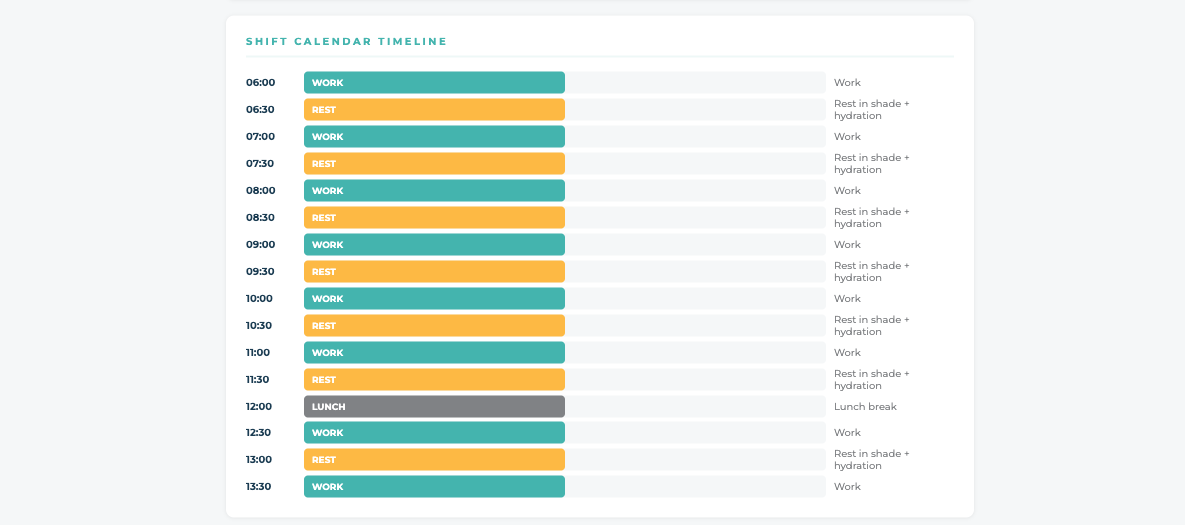
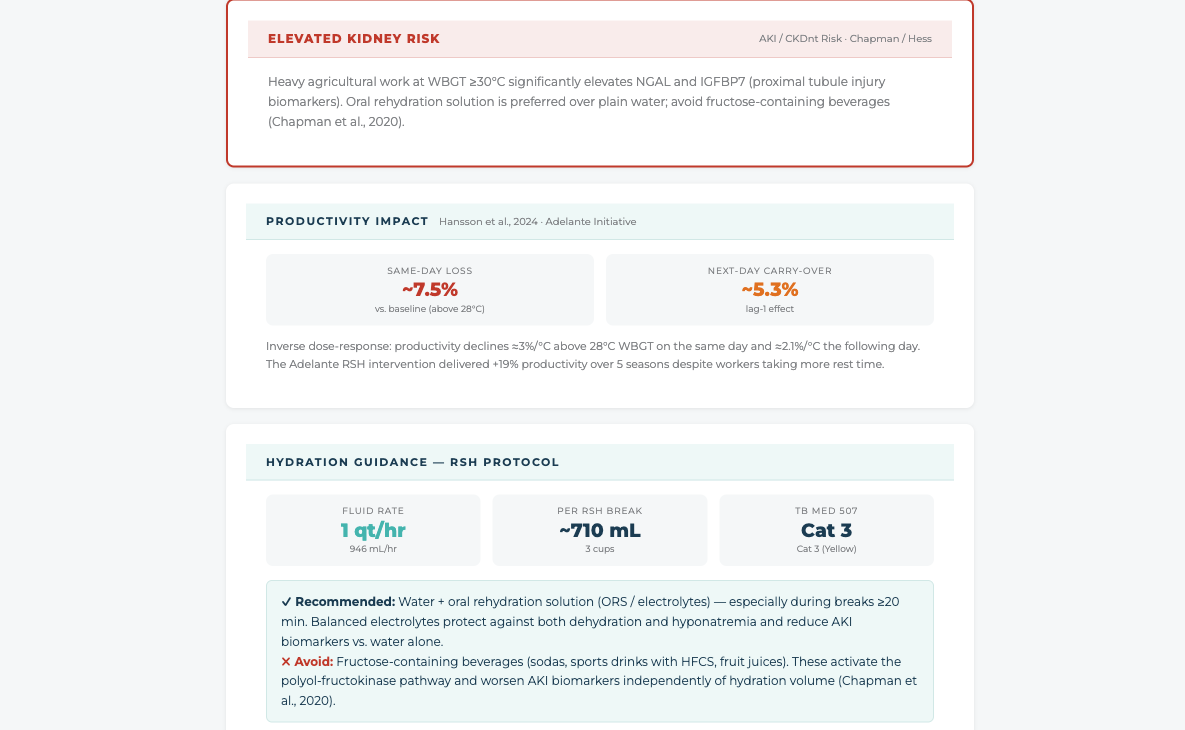
From that one composite the tool builds the things a supervisor actually plans around.
Why it’s trustworthy, and how it stays current
Heat guidance is only useful if the numbers are the real, current numbers. The project treats that as a machine-enforced property, not a promise.
The four-place sync invariant
Every registered standard must be mirrored in four places that a deterministic script checks on every CI and nightly run:
data/standards/<id>.json, the authoritative per-standard registry record;formulas.js, the inline registry entry and the actual compute function;data/sources.jsonplusstandard-details.json, citations and plain-language logic;country_guidance.md, the human-readable research map.
If those four ever drift (a threshold changed in one place but not the others, or an engine reads an input the registry didn’t declare), the build fails. The number you read on screen cannot silently diverge from its cited source.
An autonomous source-health ladder
Four scheduled GitHub Actions keep the sources alive, all deterministic (no AI in the loop):
- Weekly link health escalates through a cost-free ladder (plain fetch, then headless Chromium, then Tavily, then archive.org) and classifies each of ~110 source URLs as healthy, bot-walled-but-live, redirected, archived, or dead. Bot-walled URLs that a human re-verified live are allow-listed on a 90-day TTL so a scraper 403 doesn’t cry wolf.
- Monthly content-diff re-fingerprints every text source and diffs it against a stored snapshot; a material change is the strongest automatable signal of a legal amendment and files an issue naming the affected engine for a recheck.
- A dedicated AEMET feed monitor watches the two live-data paths behind Spain’s heat-aviso engine, and a nightly maintenance job runs the full test suite plus the sync audit.
Mechanically regenerated artifacts auto-merge only after a re-verification pass; anything that looks like real legal or logic drift always becomes a human-reviewable issue, never a silent edit.
How new rules get in: the fleet pipeline
Adding and re-checking guidance runs as a defined pipeline: discover (scan jurisdictions in their home language for missing rules) → verify & implement (research against primary sources, write the engine, JSON, docs, and tests) → maintain → security review → frontend QA → digest (weekly triage into one to-do list). Research and implementation are separated so nothing lands without a review pass.
The suite checks more than output numbers. Comments pin down why a value matters: “must not leak into another jurisdiction,” “must not fabricate a stop-work threshold,” “the composite must not include the smoke engine.” A test that couldn’t fail when the safety logic changes is treated as a broken test.
Every result carries its citation, a legal-status label (regulation vs. guidance vs. not-yet-effective proposal), and, when required inputs are missing, an explicit “can’t evaluate this” note. Standards refuse to guess rather than invent a plausible number.
Depth of research is documented too: an 18-chapter legislative-history book traces the enactment timeline, triggering events, and advocacy behind a priority set of jurisdictions, including Qatar, California, India, China, Spain, and the EU.
Where the WBGT number comes from
Everything downstream — every standard, every work/rest schedule — is a function of one number. This section is about how that number is produced, and where it is and is not trustworthy.
The Forecast Source
When you use the “Use my location” or city-search paths, the WBGT is estimated from a weather forecast. The forecast is sourced from Open-Meteo, worldwide. Inside the U.S., if Open-Meteo is unreachable, a fallback to the National Weather Service applies; anywhere else, and in the U.S. if that fallback also fails, the forecast comes from MET Norway (data licensed CC BY 4.0; the WBGT is computed here, not supplied by them). Neither fallback publishes solar radiation, so on those paths the solar term is modelled from cloud cover and the sun’s position, and the reading says so. The forecast gives air temperature, humidity, wind, solar radiation, and pressure — not a wet bulb or a black globe. Both missing terms are modelled from the same published energy-balance equations, checked line by line against the reference implementation they come from. Four things are worth knowing without reading the internals: the estimate is never smoothed downward, every reading carries an uncertainty band computed for that hour, hours where wind could move the answer by a degree or more are flagged as approximate, and the reading always states which model produced it. The full derivation is below for anyone who needs it.
The definition
Wet Bulb Globe Temperature is a weighted blend of three separate thermometers, not a single reading:
| Setting | Formula |
|---|---|
| Outdoors, with solar load | WBGT = 0.7·Tnwb + 0.2·Tg + 0.1·Tdb |
| Indoors / no solar load | WBGT = 0.7·Tnwb + 0.3·Tg |
Tnwb is the natural wet bulb: a wetted wick in ambient air and sunlight, not spun or aspirated. Tg is a black globe thermometer. Tdb is ordinary air temperature. The 0.7 weighting on humidity is why WBGT punishes humid heat so much harder than a plain thermometer does.
The psychrometric wet bulb (what a sling psychrometer or a weather API usually reports) is measured under forced airflow and reads lower than the natural wet bulb under sun. Substituting one for the other without correction under-estimates WBGT, which is the unsafe direction. The app treats them as different quantities and says which one it used.
Three ways a WBGT enters this app
A forecast reports neither a natural wet bulb nor a black globe, so on that third path both missing thermometers are modelled from the same published energy-balance equations, checked line by line against the reference implementation they come from. Four things are worth knowing without reading the internals: the estimate is never smoothed downward, every reading carries an uncertainty band computed for that hour, hours where wind could move the answer by a degree or more are flagged as approximate, and the reading always states which model produced it. The full derivation is below for anyone who needs it.
Advanced: how the forecast estimate is modelledDeep detail
Estimating WBGT from forecast weather
Forecasts give air temperature, humidity, wind, solar radiation and pressure — not a wet bulb or a black globe. Both missing terms are modelled from one source: Liljegren et al. (2008), the heat-and-mass-transfer algorithm behind OSHA’s own outdoor WBGT calculator, which ships the Argonne reference code. The US National Weather Service uses a different method for its forecast grids — Dimiceli & Piltz (2013) for the globe and a regression for the natural wet bulb — so an NWS WBGT and this one can differ even on identical weather.
An energy balance for the wetted wick (forced convection + solar + longwave + evaporative cooling), solved iteratively to 0.02 K. Air properties are recomputed at the film temperature on every pass.
The same treatment for a matte-black sphere — 50.8 mm, the reference model’s own diameter, rather than the 150 mm globe ISO 7243 specifies for the physical instrument. Its convection term keeps the conduction limit, so it stays physical in dead calm, and it is solved at night too — where a globe is not equal to air temperature.
Using one paper for both halves is deliberate. They share one set of constants, one direct-beam fraction and one wind height, so the two components of a single WBGT cannot drift apart. The direct-beam split is itself derived rather than assumed: it comes from how close the hour’s irradiance sits to the top-of-atmosphere value.
The port is checked against the reference, not trusted. The original C is vendored into the repository, compiled in CI, and run over a 320-point grid; the JavaScript must match it at every point. That check found three real defects on its first run — a wrong starting guess for the wick iteration, an unnecessary night-time restriction, and an invented sanity envelope that was rejecting correct answers in calm, humid, sunlit air and replacing them with values about 4 °C of WBGT too low.
One further correction: the models are calibrated to wind at 2 m, but forecasts report wind at 10 m. The app converts using the neutral log-law factor ln(2/z₀)/ln(10/z₀), where z₀ is the surface roughness length. Where the forecast supplies wind at both 10 m and 80 m, z₀ is inferred from that wind profile, so a worksite in a city or under a canopy is no longer given a field’s wind; otherwise the app assumes open terrain (z₀ ≈ 0.03 m, factor 0.72). Lower wind gives a higher, more protective reading, so assuming open terrain everywhere was the unprotective assumption.
The near-calm limitation, and what the app does about it
The wick model is a forced-convection formula — Nu = b·Re^0.6·Pr^0.44 — with no free-convection term, so below roughly 0.5 m/s it is extrapolating outside the range it was fitted for, and the estimate becomes more sensitive to wind than an hourly forecast can resolve. (The globe model is better behaved: its convection term keeps a conduction limit, so the balance stays bounded at zero wind. That is one of the reasons it replaced the linearised model previously used here. Both models still floor the wind at the reference implementation’s own minimum, as the reference itself does.)
A real example, from a Phoenix forecast: an 09:00 hour reporting 0.14 m/s wind, between neighbours of 1.49 and 0.70 m/s, produced an estimated WBGT about 7 °C above the hour before it.
The uncertainty band
Every estimate carries a band, computed for that hour rather than asserted: the spread between the two independent globe models, the gap the psychrometric fallback would cost if it had to be used, the wind sensitivity above, and the measured cost of running on a forecast at all — summed in quadrature. It is floored at the reading’s own rounding, because a band of zero on a number reported to 0.1 °C would claim knowledge the model does not have.
That fourth term is the largest, and until recently it was missing. Driving the chain from a weather forecast instead of from sensors standing at the site costs 1.52 °C RMS — measured, by running the estimator twice over 9,846 hours at eight Japanese observatories, once on the forecast and once on the instruments, and taking the RMS of the difference. It is larger than every model-form term combined. Without it a reading could carry ±0.3 °C and be mistaken for a claim about total error; it is not one.
The band can now be checked against reality rather than only against another model. Over 13,210 daylight hours at Japan’s instrumented sites the residual spread is about 1.9 °C, and the band the app reports for those same hours averages about 1.8 °C. Two automatic checks run on every CI run: the estimation chain against the reference model over 144 observed hours across six climates, and the whole chain against real WBGT instruments — the section above.
Confidence levels on an estimate
| Label | Meaning |
|---|---|
forecast_estimate_physical_weather | Full physical inputs available, both energy-balance models solved, and solar geometry computed from real coordinates. The best the forecast path offers. |
forecast_estimate_full_weather | All inputs present, but the solar geometry had to be assumed, or the globe fell back to the linearised or screening estimate. |
forecast_estimate_partial_weather | Some inputs were missing or out of range; warnings explain which. |
Out-of-range sensor and forecast values are surfaced as warnings with the raw value preserved — the app does not silently clamp inputs and then present the result as clean.
How accurate is the estimate, really?
Every check described above compares one model against another model. That proves the code is a faithful port; it proves nothing about whether the number matches a WBGT meter standing in a field. To answer that, the estimator was tested against real instruments.
Japan’s Ministry of the Environment runs a heat-illness prevention network publishing WBGT at 841 points. At 47 of them — one per prefecture — the black globe is a real instrument: a 6-inch (15 cm) black globe thermometer in the observatory’s enclosure, alongside the Japan Meteorological Agency’s own temperature and humidity sensors. The other ~794 points are modelled. Only the 47 are used here.
The headline numbers
13,210 daylight hours across eight sites from subarctic Sapporo to subtropical Naha, April–July 2026. The residual is our estimate minus the instrument; a negative value means the app read cooler than reality, which is the unsafe direction.
| Inputs the model was given | Bias | RMSE | Hours |
|---|---|---|---|
| Weather forecast — what the app actually serves | +1.49 °C | 2.39 °C | 13,210 |
| Measured sensors — the WBGT model alone | +1.07 °C | 1.52 °C | 9,846 |
Two things follow, and the second is the more useful one.
Compared against Japan’s official method
Japan is the rare case where a government publishes both its instruments and its formula, so the app’s model can be scored directly against a national standard on identical inputs.
| Model, run on the same measured sensors | Bias | RMSE |
|---|---|---|
| This app (ISO 7243, Liljegren wick + globe) | +1.07 °C | 1.52 °C |
| Ono & Tonouchi (2014) — Japan’s operational formula | +0.40 °C | 0.76 °C |
Japan’s formula is the tighter fit. That is close to expected: it is a regression trained on exactly this quantity at exactly these sites, while a good part of our residual is the difference in what the two are measuring, described next. The honest summary is that we are in a comparable class against a home-field benchmark — enough to trust the estimate at a Japanese site, not enough to claim parity. It is also why, in Japan, the app now prefers the Ministry’s own number over its own.
Japan uses WBGT = 0.7·Tw + 0.2·Tg + 0.1·Ta — structurally identical to the outdoor formula above. But their Tw is a psychrometric wet bulb computed under forced ventilation (JMA’s aspirated screen, ~5 m/s), where ours is a natural wet bulb. These are different physical quantities. The Ministry says so itself and states the direction: a natural-ventilation WBGT runs higher than theirs, with the gap widening in cool, dry air. So our reading sitting above theirs is a definition difference, not an error on either side.
What the app does about it in Japan
Japan’s warning bands (25 / 28 / 31 / 35 °C) are calibrated against the Ministry’s quantity, not against ISO 7243. Comparing our natural-wet-bulb value to those bands would trip them early. For a worksite inside Japan the app therefore prefers a Japan-consistent number, in this order:
Outside Japan none of this applies and nothing changes. Proximity to the Ministry’s network — not a map box — decides where it applies, because any rectangle drawn around Japan also contains Seoul and Busan.
This is a Japanese-summer result: humid coastal to subtropical, April–September, 47 fixed instruments. It is not a global accuracy figure, and the forecast-error term derived from it is not a global constant. Hot arid high-sun conditions — the Gulf, the US Southwest — are not represented, and that is where the black-globe model is least tested: against the real instrument it now overshoots by about 2 °C in strong sun, having previously fallen short by six. Each site is also a single instrument, so its own calibration error sits inside these numbers.
Sources: 環境省熱中症予防情報サイト (wbgt.env.go.jp), 公共データ利用規約 第1.0版; 気象庁 過去の気象データ; 小野雅司ら (2014)「通常観測気象要素を用いたWBGTの推定」日本生気象学会雑誌 50(4), 147–157..
How the calculation works
The whole engine is pure functions over a plain input object. Here is the pipeline, with the real constants.
1 · Effective WBGT = raw WBGT + clothing adjustment
Clothing traps heat, so the reading is bumped up by a Clothing Adjustment Factor (CAF, in °C) before any standard sees it. The screening is then run against that effective number.
| Clothing | CAF (°C) | Basis |
|---|---|---|
| Standard work clothing / cloth coveralls | 0 | ACGIH/NIOSH 2006 baseline |
| SMS polypropylene coveralls | +0.5 | ACGIH/NIOSH 2006 |
| Polyolefin coveralls | +1.0 | ACGIH/NIOSH 2006 |
| Double-layer cloth clothing | +3.0 | ACGIH/NIOSH 2006 |
| Limited-use vapor-barrier suit | +11.0 | Encapsulating; WBGT screening not reliable |
Three additional rows (cotton robes +2, winter uniform +4, impermeable wet-weather gear +6) come from Nicaragua’s Resolución Ministerial, converted from a “deduction from the limit” framing into an additive burden so they compose with the rest of the pipeline.
2 · Workload → metabolic rate
Work intensity is carried as an actual metabolic rate in watts, never a bare label. An unrecognized workload defaults to heavy, which is deliberately the more protective choice.
| Category | Metabolic rate |
|---|---|
| Light | 180 W |
| Moderate | 300 W |
| Heavy | 415 W |
| Very heavy | 520 W |
3 · Two acclimatization models, kept separate on purpose
This is a genuine disagreement between standards, and the tool refuses to blend it:
ACGIH publishes separate screening criteria for acclimatized workers (the TLV) and unacclimatized workers (the Action Limit), and the app reads both directly. The gap between them is not constant — 2.5°C on most light-work rows, 3.5°C on heavy — so the Action Limit cannot be derived by offsetting the TLV. ACGIH defines only those two tiers; “partial” is this project’s midpoint of the two, labelled as such wherever it appears.
For an unacclimatized crew it re-evaluates the same 5-band table at effective + 3°C and keeps the stricter of the two rows (min work, max rest). Partial is treated as fully acclimatized, with no partial penalty.
4 · Dispatch across 90+ engines, then composite
compareStandards(input, 'all') runs every registered engine and decorates each result with its registry metadata. getMostProtective(results) then reduces them:
workMinutesPerHour = Math.min(...) and restMinutesPerHour = Math.max(...) across all schedule-type contributors. The two winners need not be the same standard.smoke_overlay are shown but never enter the min/max. A wildfire-smoke result can never contaminate the work/rest schedule.Worked example: WBGT 30°C, heavy work, unacclimatized, no clothing penalty
Real numbers, computed by the engine:
| Standard | Work / rest (min/hr) | State |
|---|---|---|
| La Isla RSH-s primary | 10 / 50 | Band 29.4 to 31.1°C, heavy; the unacclimatized +3°C bump re-checks at 33°C and keeps the stricter row |
| ACGIH TLV / Action Limit | 0 / 60 | Exceeds screening criteria: the published unacclimatized Action Limit for heavy work puts 30°C above its 0–25% value, so no work allocation passes |
| TB MED 507 | 30 / 30 | Non-zero schedule (no hard-stop state modeled here) |
Composite result: stopWork: true, triggered by ACGIH TLV / Action Limit. Even though the La Isla primary card still shows a live 10/50 schedule, the composite reports a full stop-work because ACGIH’s “exceeds screening criteria” (0 minutes) is a stop-work-eligible result, so the override wins over the min/max schedule, exactly as designed. That is the safety posture: one credible cease-work call beats any schedule.